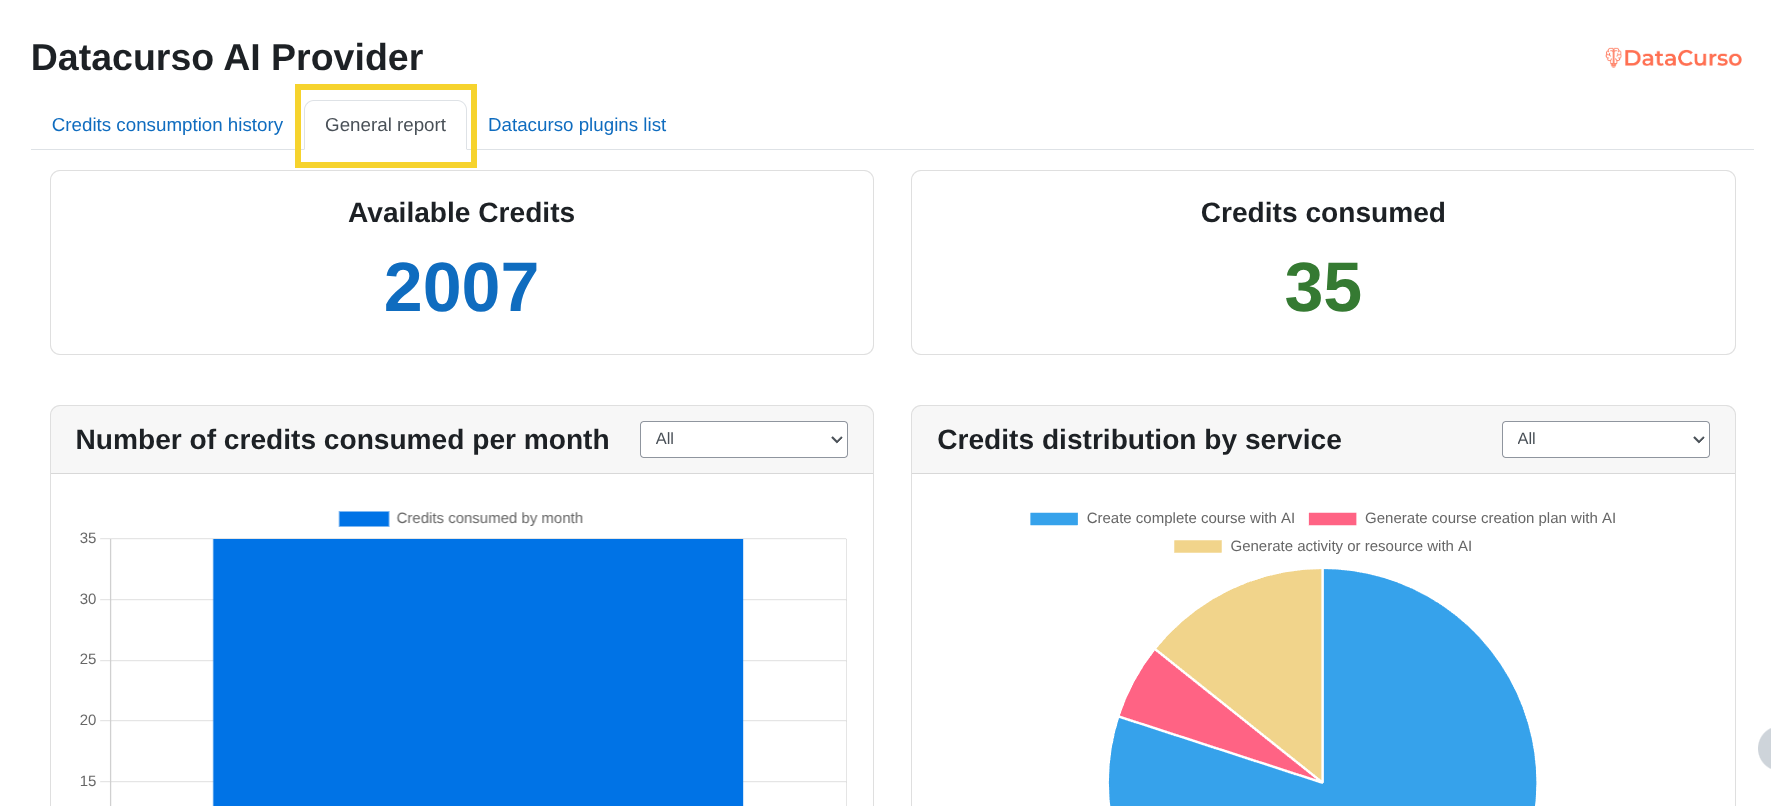
General report
The General report tab provides visual summaries of credit usage.
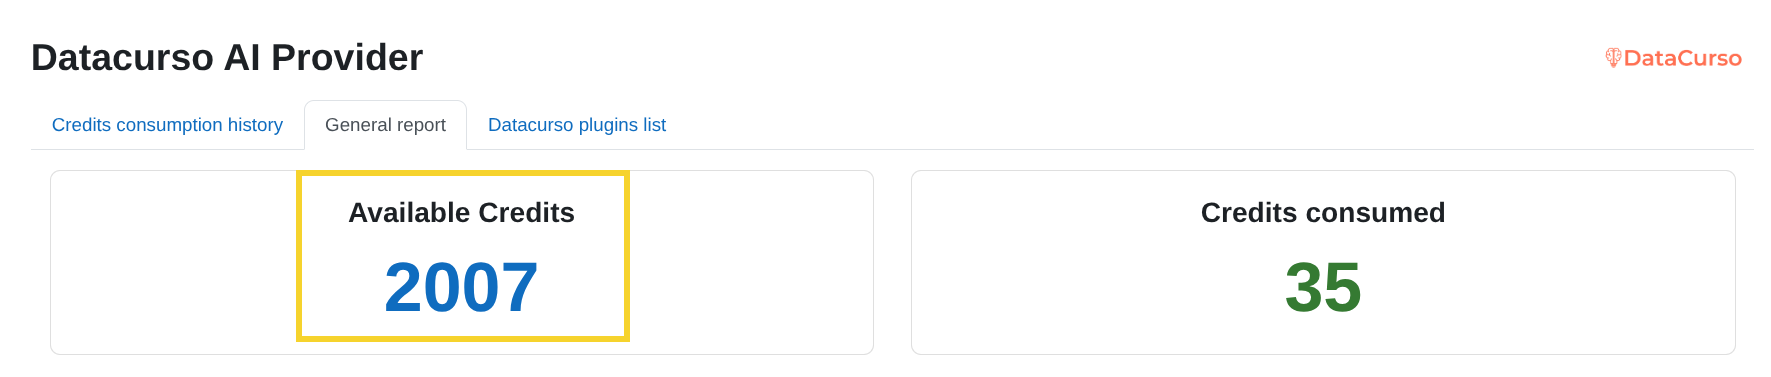
Available Credits
Displays the number of AI credits currently available.
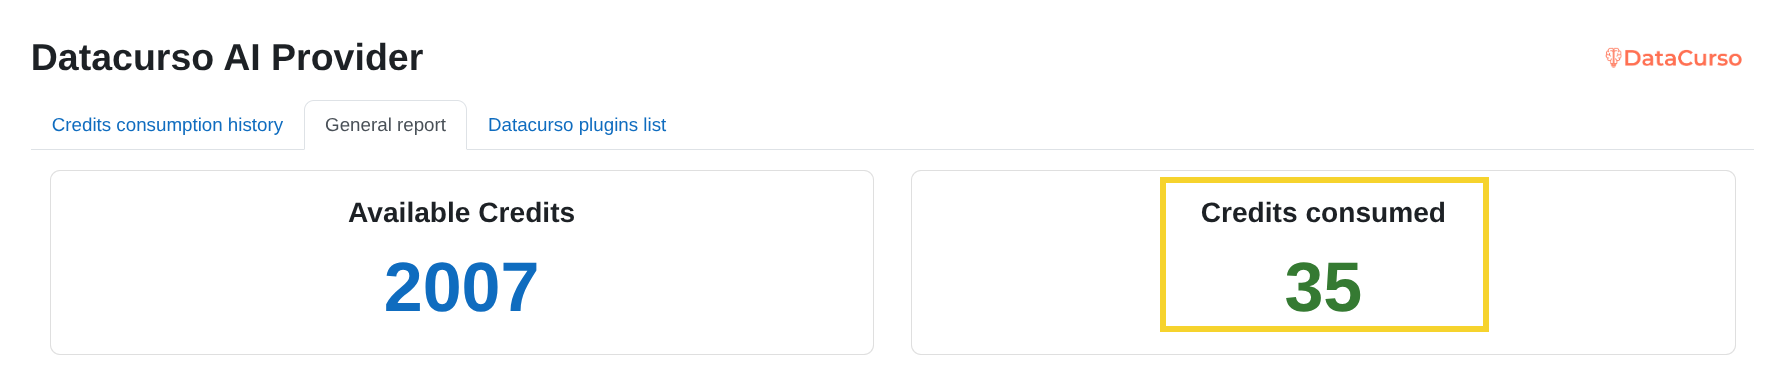
Credits consumed
Displays the total number of credits consumed within the selected period.
Number of credits consumed per month
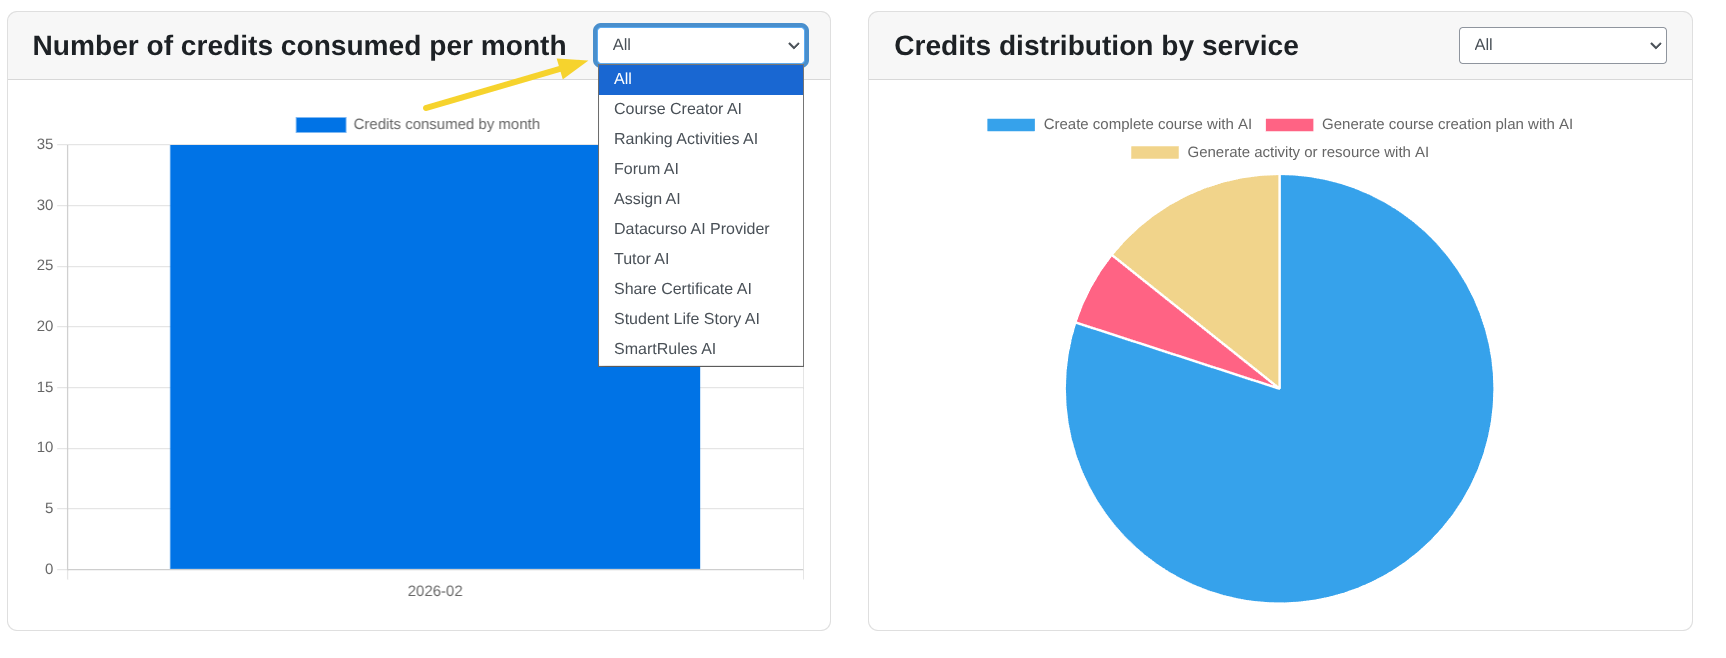
This chart shows the total number of credits used per month.
You can use the service selector to filter the chart by a specific AI service.
Credits distribution by service
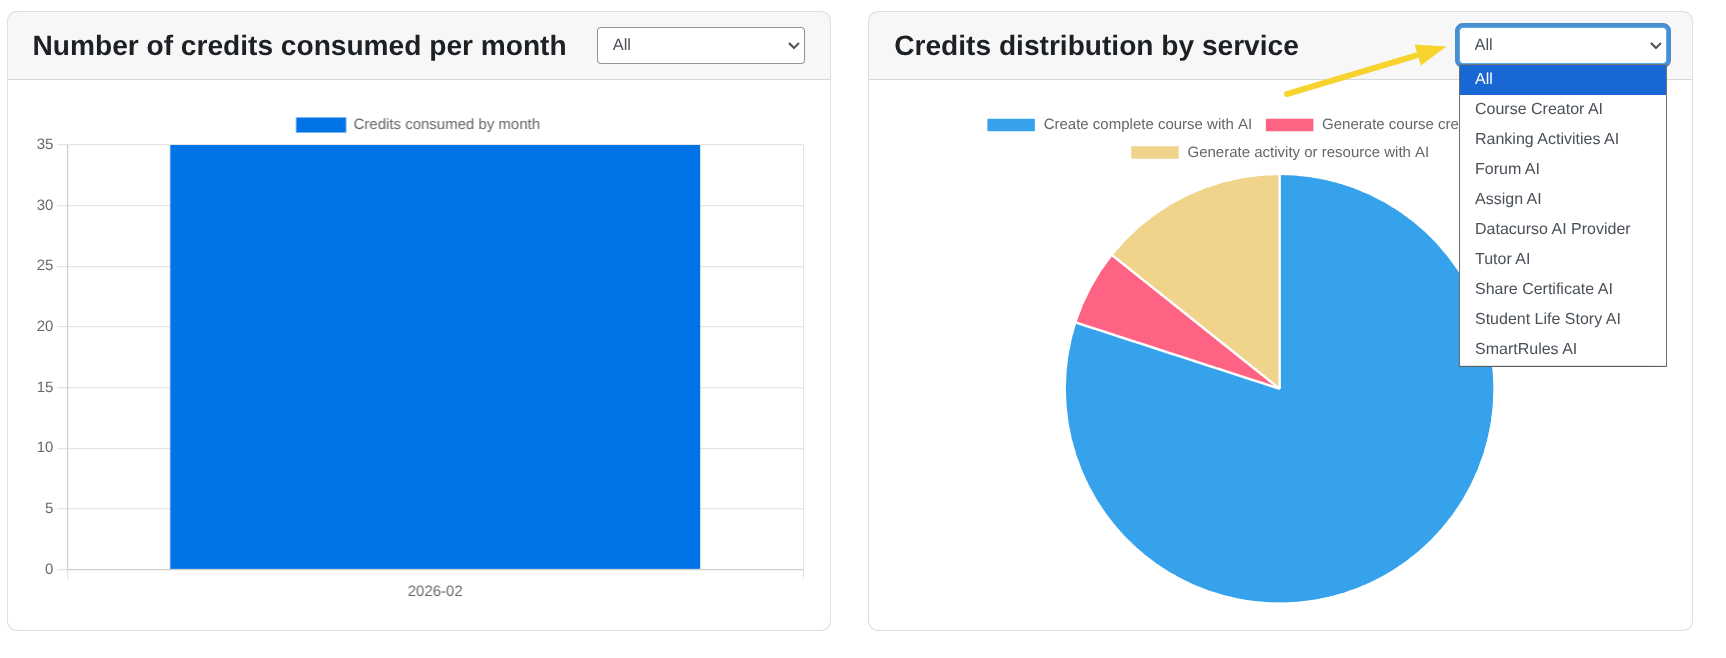
This pie chart shows how credit usage is distributed across different AI services.
You can also filter this chart by selecting a specific service.
Credits consumed by user per service
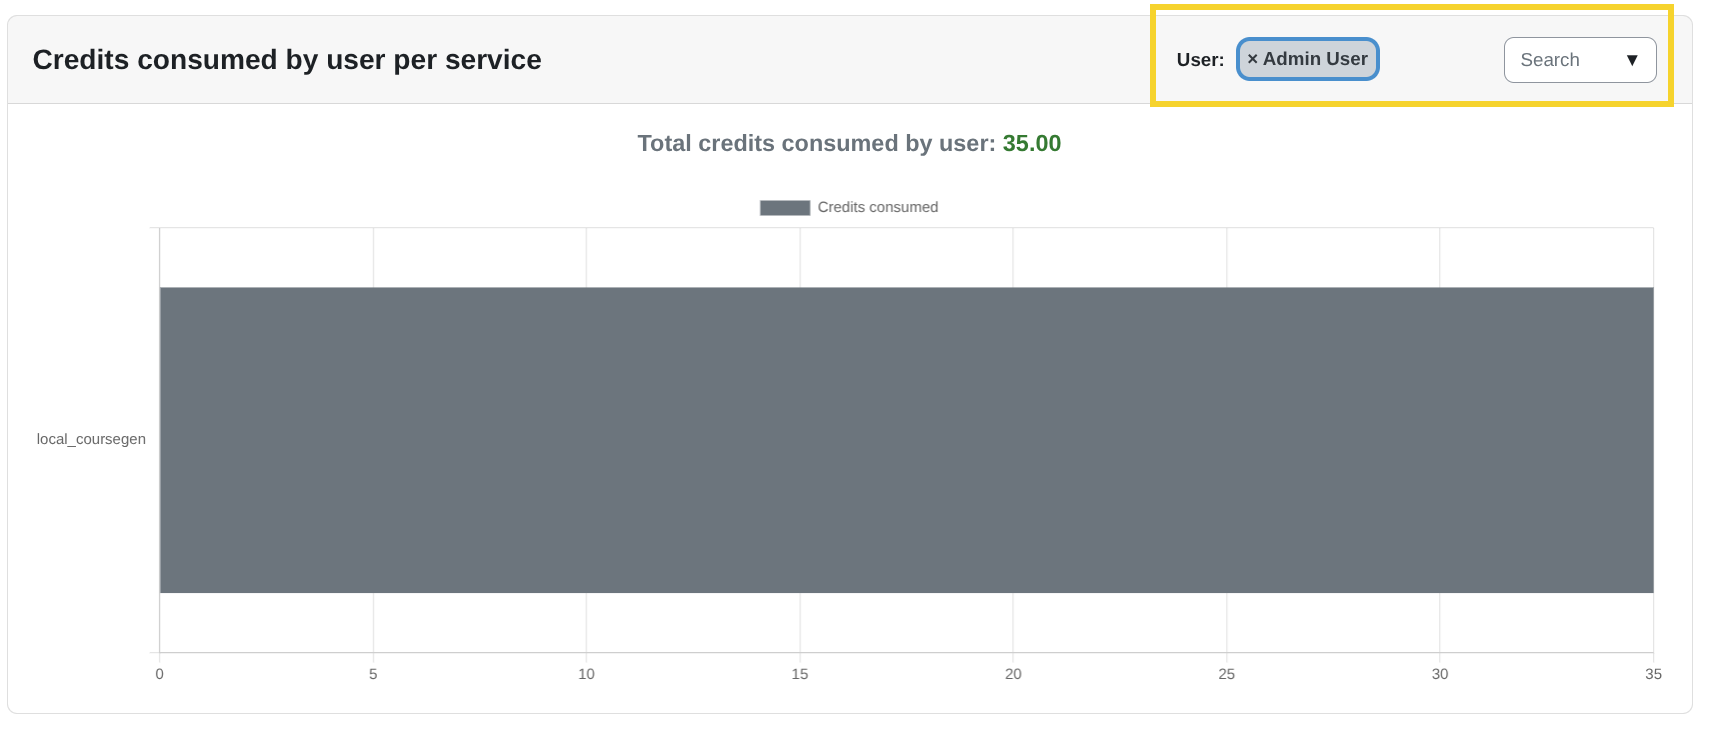
This chart allows you to filter by a specific user and see how many credits they have consumed per service.
The user search field allows you to quickly find a specific user.
Credits consumption by day
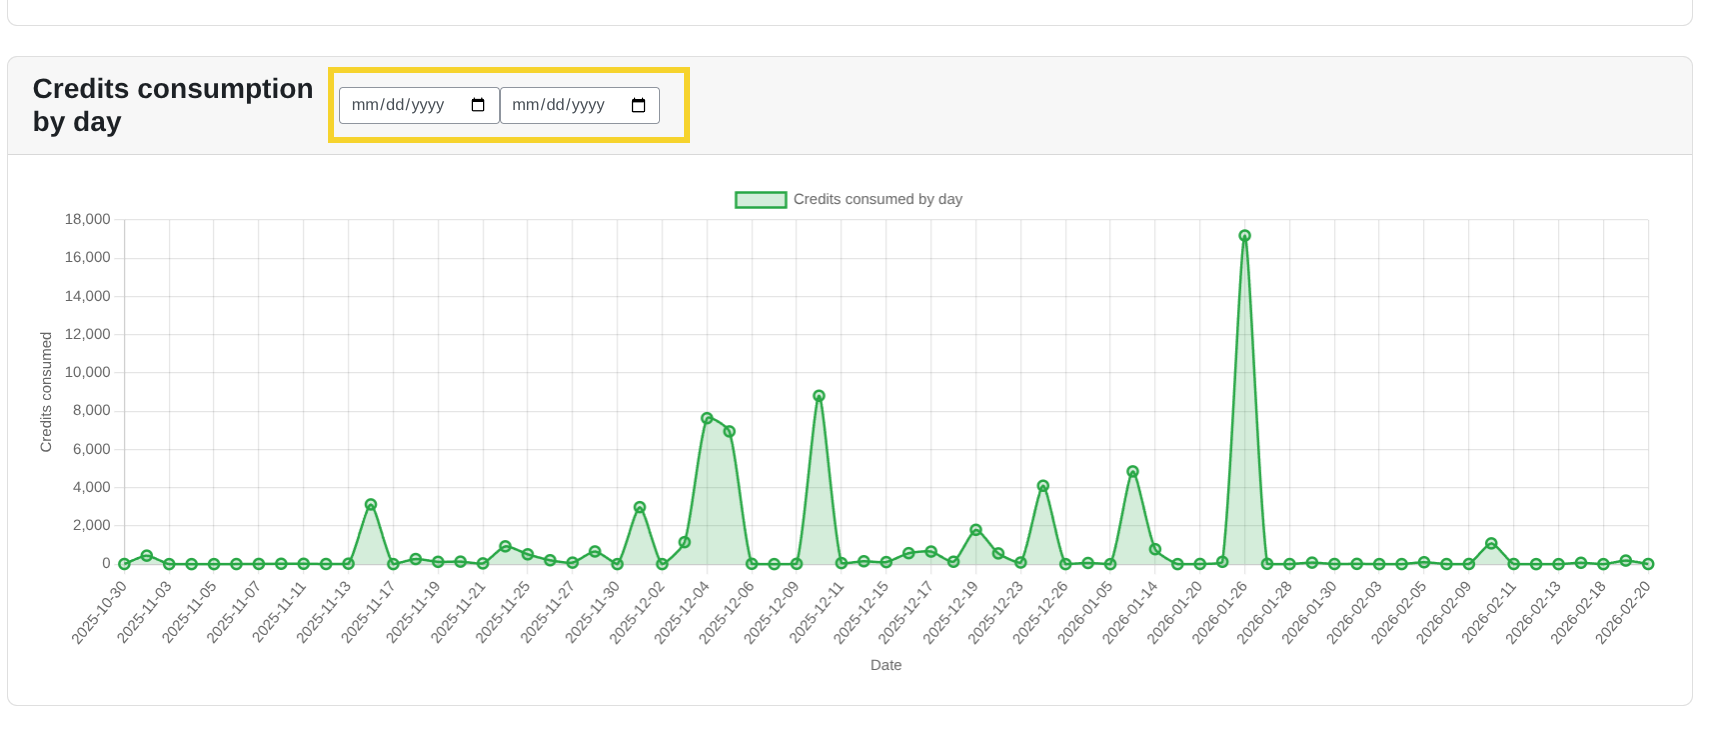
This line chart shows daily credit consumption within the selected date range.
You can use the date fields to define the period you want to analyse.